A few cores too many
Performance matters for software systems, but performance is not always easy to measure. At the PRL we recently had a scare with some unreliable measurements. Here is the story.
Last year, we proposed a method for evaluating the performance of gradual type systems based on measuring every possible configuration of typed and untyped code that a programmer might explore (pdf). Given the freedom that gradual typing offers, this is the only realistic way to measure the performance of a gradual type system.
But it is a lot to measure! While developing the method, we spent over 3 months benchmarking a total of 75,844 configurations. Each configuration is a complete program and some gradual typings caused some programs to slow by 50x or even 100x, so many of these configurations took minutes to run.
The next question we asked was naturally “how can we scale this method to large software projects?” In our case, the number of gradually typed configurations scaled exponentially with the number of modules. Current gradual type system for Python and JavaScript are exponential in the number of variables in the program.
We explored two solutions:
- Max New began work on a prediction model (inspired by work on software product lines) to estimate the performance of
2^Nconfigurations after polynomially-many measurements. - Asumu Takikawa and I shopped for a multi-core computer.
By Thanksgiving, we had bought a Linux machine with 2 AMD Opteron 6376 2.3GHz processors (16 cores each) and put it to work running benchmarks on 29 cores simultaneously. Life was good.
Later that winter, Max implemented a prediction algorithm. The basic idea was to focus on boundaries between modules and isolate their effect on performance. If two modules are untyped, their boundary will have zero cost. If the same two modules are typed, their boundary might result in an overall performance improvement due to type-driven optimizations. And if one module is typed and the other untyped, their boundary will suffer some cost of type checking at runtime. In general a program with N modules has at most N(N - 1) / 2 internal boundaries, so it is far more time-efficient to measure only the boundaries than to benchmark 2^N gradually typed configurations.
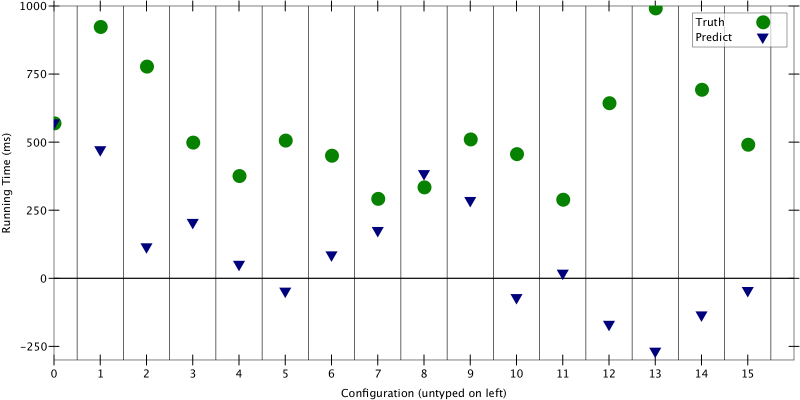
Fast-forward to March, we had a prototype prediction algorithm and it was time to test. Again using 29 cores (because, why not), we gathered cost/benefit numbers for one 4-module benchmark and used them to predict performance for its 16 configurations. The results were not very good.

Figure 1: True running time vs. predicted running time for 16 configurations
Those green circles are the ground truth, the average running time after 5 iterations of each config. The blue triangles are what we predicted. Except for configurations 0 and 8, the triangles are FAR off from the truth. Many are even negative … obviously the algorithm needs work.
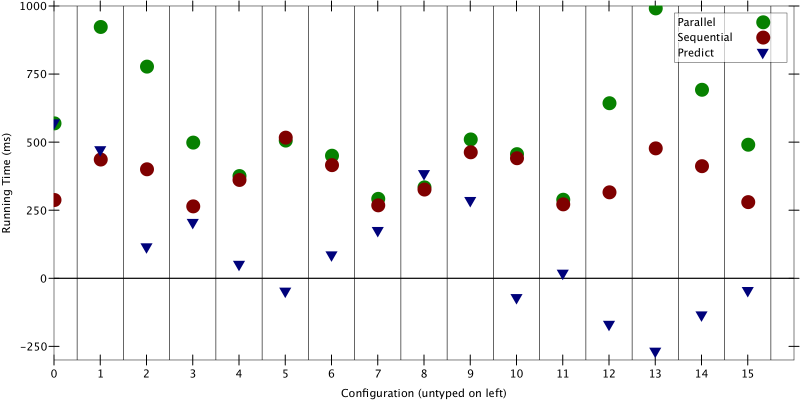
But then, out of frustration, desperation, or just good luck, Max compared the predictions to ground truth data gathered on a single core, leaving the other 31 cores idle.

Figure 2: Predictions made using measurements from a single core
First off, the red “sequential truth” dots are slightly closer to the predicted triangles. Second — and this is the scary part — the red dots are very different from the green dots. Running on 1 core vs. 29 cores should not change the measurements!
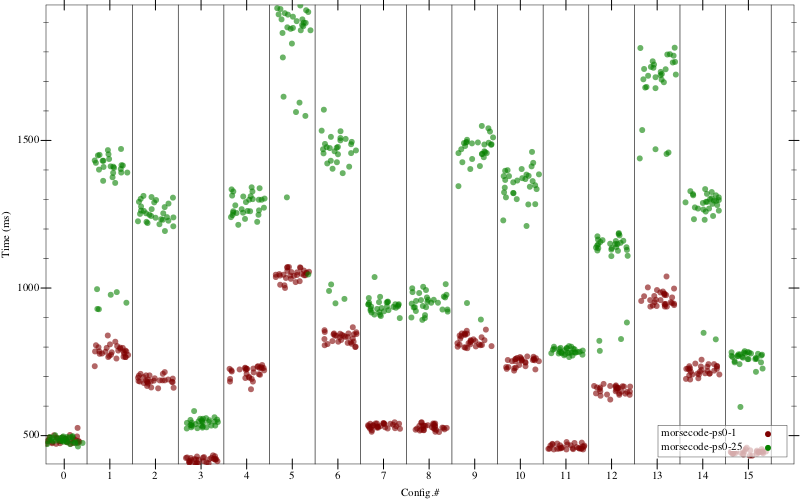
From here we tried increasing the running time of the benchmark, removing I/O and system calls, checking for hyperthreading (ARM cores don’t support it), and even changing the cores’ CPU governor. The hope was that results taken from 1 core could match results from N cores, for some N > 1. It turns out N = 2 was stable, but even for N = 3 we found graphs like the following:

Figure 3: exact running times. Same-colored dots in each column should be tightly clustered.
This data is for the same 16 configurations as the previous two graphs. Green dots are exact running times measured with 25 cores. Red dots are running times measured with 1 core. The red dots are much closer together, and always unimodal. The green dots are evidence that maybe the 32-core machine has, as Jan Vitek put it, 30 cores too many.
“Oh my. You think it’ll never happen to you. Well, now I’ve learned my lesson.”
And so, we said goodbye to the last 4 months of data and started over running at most two cores. The new results are all stable, but still we keep pinching ourselves.
P.S. the results from POPL 2016 are just fine, as they were not taken on the new machine running more than 2 cores. If you have time to confirm, that data is in our artifact and in the gradual-typing-performance repo.